Camel K introduces new ways of dealing with integration problems by letting you develop and run routes in the cloud, where the services that you need to connect live. This has many advantages, since it makes it easy to use all the features available in the cloud environment from the very beginning. For example, you can leverage service discovery, you can make your integration passive and let it receive push notifications from Knative with real data… But this comes with a cost.
When something goes wrong while you’re developing a new integration, you’d like to easily understand what’s going on and fix your code.
Since the integration is not running locally, it’s not easy to leverage all your IDE tools to troubleshoot.
But we’re working to improve the experience on many fronts. I’m describing here the new kamel debug command.
Debug command
Suppose you’re working on an integration problem and you’ve designed your route as:
import org.apache.camel.Header;
import org.apache.camel.builder.RouteBuilder;

public class Flaky extends RouteBuilder {
  @Override
  public void configure() throws Exception {

    from("timer:clock?period=5000")
    .bean(this, "createPayload")
    .to("https://postman-echo.com/post")
    .log("sent!");

  }

  public String createPayload(@Header("CamelTimerCounter") Integer tick) {
    return "" + (100 / (tick - 1));
  }

}
Note: I’m writing the “createPayload” method directly in the route file, but likely you’ll put it in a separate library.
This is a simple route that every 5 seconds builds a payload and sends it to a HTTPS destination.
You can run it with:
kamel run Flaky.java
Once it starts, you notice that there’s an issue in the way the payload is built, since the output signals an error in the first exchange.
[1] 2020-11-30 09:22:02,377 WARN  [org.apa.cam.com.tim.TimerConsumer] (Camel (camel-1) thread #0 - timer://clock) Error processing exchange. Exchange[746A22E1144A36D-0000000000000000]. Caused by: [java.lang.ArithmeticException - / by zero]: java.lang.ArithmeticException: / by zero
[1]     at Flaky.createPayload(Flaky.java:18)
[1]     at java.base/jdk.internal.reflect.NativeMethodAccessorImpl.invoke0(Native Method)
[1]     at java.base/jdk.internal.reflect.NativeMethodAccessorImpl.invoke(NativeMethodAccessorImpl.java:62)
[1]     at java.base/jdk.internal.reflect.DelegatingMethodAccessorImpl.invoke(DelegatingMethodAccessorImpl.java:43)
[1]     at java.base/java.lang.reflect.Method.invoke(Method.java:566)
[1]     at org.apache.camel.support.ObjectHelper.invokeMethodSafe(ObjectHelper.java:208)
[1]     at org.apache.camel.component.bean.MethodInfo.invoke(MethodInfo.java:425)
[1]     at org.apache.camel.component.bean.MethodInfo$1.doProceed(MethodInfo.java:247)
[1]     at org.apache.camel.component.bean.MethodInfo$1.proceed(MethodInfo.java:217)
[1]     at org.apache.camel.component.bean.AbstractBeanProcessor.process(AbstractBeanProcessor.java:154)
[1]     at org.apache.camel.component.bean.BeanProcessor.process(BeanProcessor.java:56)
[1]     at org.apache.camel.processor.errorhandler.RedeliveryErrorHandler$SimpleTask.run(RedeliveryErrorHandler.java:404)
[1]     at org.apache.camel.impl.engine.DefaultReactiveExecutor$Worker.schedule(DefaultReactiveExecutor.java:148)
[1]     at org.apache.camel.impl.engine.DefaultReactiveExecutor.scheduleMain(DefaultReactiveExecutor.java:60)
[1]     at org.apache.camel.processor.Pipeline.process(Pipeline.java:147)
[1]     at org.apache.camel.processor.CamelInternalProcessor.process(CamelInternalProcessor.java:287)
[1]     at org.apache.camel.component.timer.TimerConsumer.sendTimerExchange(TimerConsumer.java:207)
[1]     at org.apache.camel.component.timer.TimerConsumer$1.run(TimerConsumer.java:76)
[1]     at java.base/java.util.TimerThread.mainLoop(Timer.java:556)
[1]     at java.base/java.util.TimerThread.run(Timer.java:506)
[1]
[1] 2020-11-30 09:22:08,088 INFO  [route1] (Camel (camel-1) thread #0 - timer://clock) sent!
[1] 2020-11-30 09:22:13,236 INFO  [route1] (Camel (camel-1) thread #0 - timer://clock) sent!
It’s easy to understand what’s wrong here, because this is a hand crafted example, but in a real integration case, your business logic may be much more complex and it won’t be easy to understand the problem, until you actually look into the running code.
There’s a new command in Camel K 1.3.0 that allows you to switch a remote integration to “debug mode”. This way the integration can be connected to your IDE and you can use breakpoints to check specific sections of the code for bugs. The kamel CLI will take care of setting the right flags on the integration and also establishing a secure tunnel to let your IDE connect to the integration.
To switch to the debug mode, just run:
kamel debug flaky
Where flaky is just the name of the integration. This is an example of output:
$ kamel debug flaky
Enabling debug mode on integration "flaky"...
Forwarding from 127.0.0.1:5005 -> 5005
Forwarding from [::1]:5005 -> 5005
[1] Monitoring pod flaky-76f67fb58-rk8g8
[1] exec java -agentlib:jdwp=transport=dt_socket,server=y,suspend=y,address=*:5005 -cp ./resources:[...] io.quarkus.runner.GeneratedMain
[1] Listening for transport dt_socket at address: 5005
As you see, the integration is waiting for you to connect your IDE on localhost on port 5005 using the debug protocol.
You can configure your IDE to attach to the process via that host an port. This is IDE specific, but all modern IDEs support remote debugging.
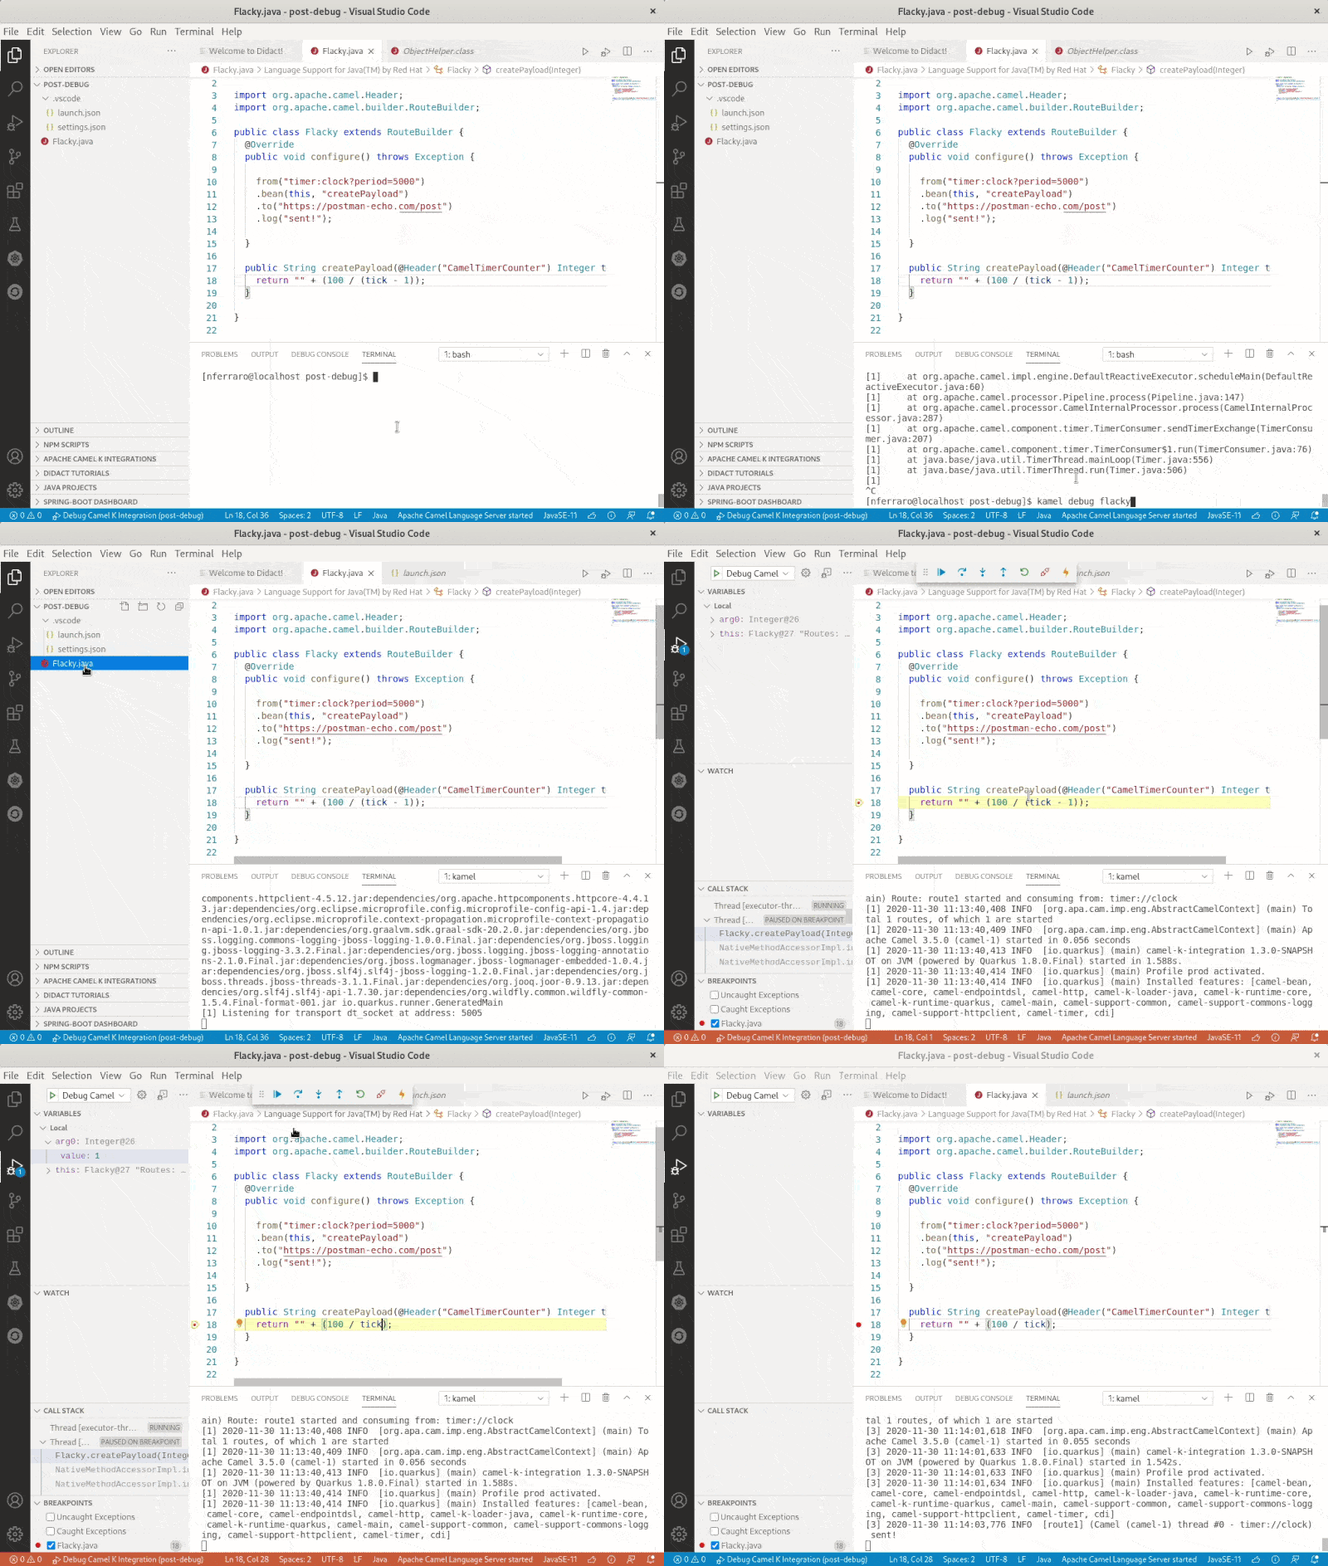
If you’re using VSCode, you can put a launch.json file in the .vscode dir at the root of your project, with the following content:
{
    "version": "0.2.0",
    "configurations": [
        {
            "type": "java",
            "name": "Debug Camel K Integration",
            "request": "attach",
            "hostName": "localhost",
            "port": 5005
        }
    ]
}
This is enough to connect. The final result is shown in the following image:

At the end of the debug session, the integration will be restored to its normal state.
Have fun with Camel K!


